
The end of the year is notoriously known as a time of personal reflection, but it’s also a time to reflect on our music consumption habits with the annual release of Spotify Wrapped!
In case you aren’t familiar with Spotify Wrapped, it’s how the music streaming giant packages their users’ data for the year. Since 2015, Spotify has released individualized reports to listeners and artists alike regarding what has resonated the most. This includes information such as top artists, songs and genres listened to, along with fun facts like how many minutes we’ve tuned into music, podcasts and more. Or if you’re like me, how much your music habits have changed since having a child.

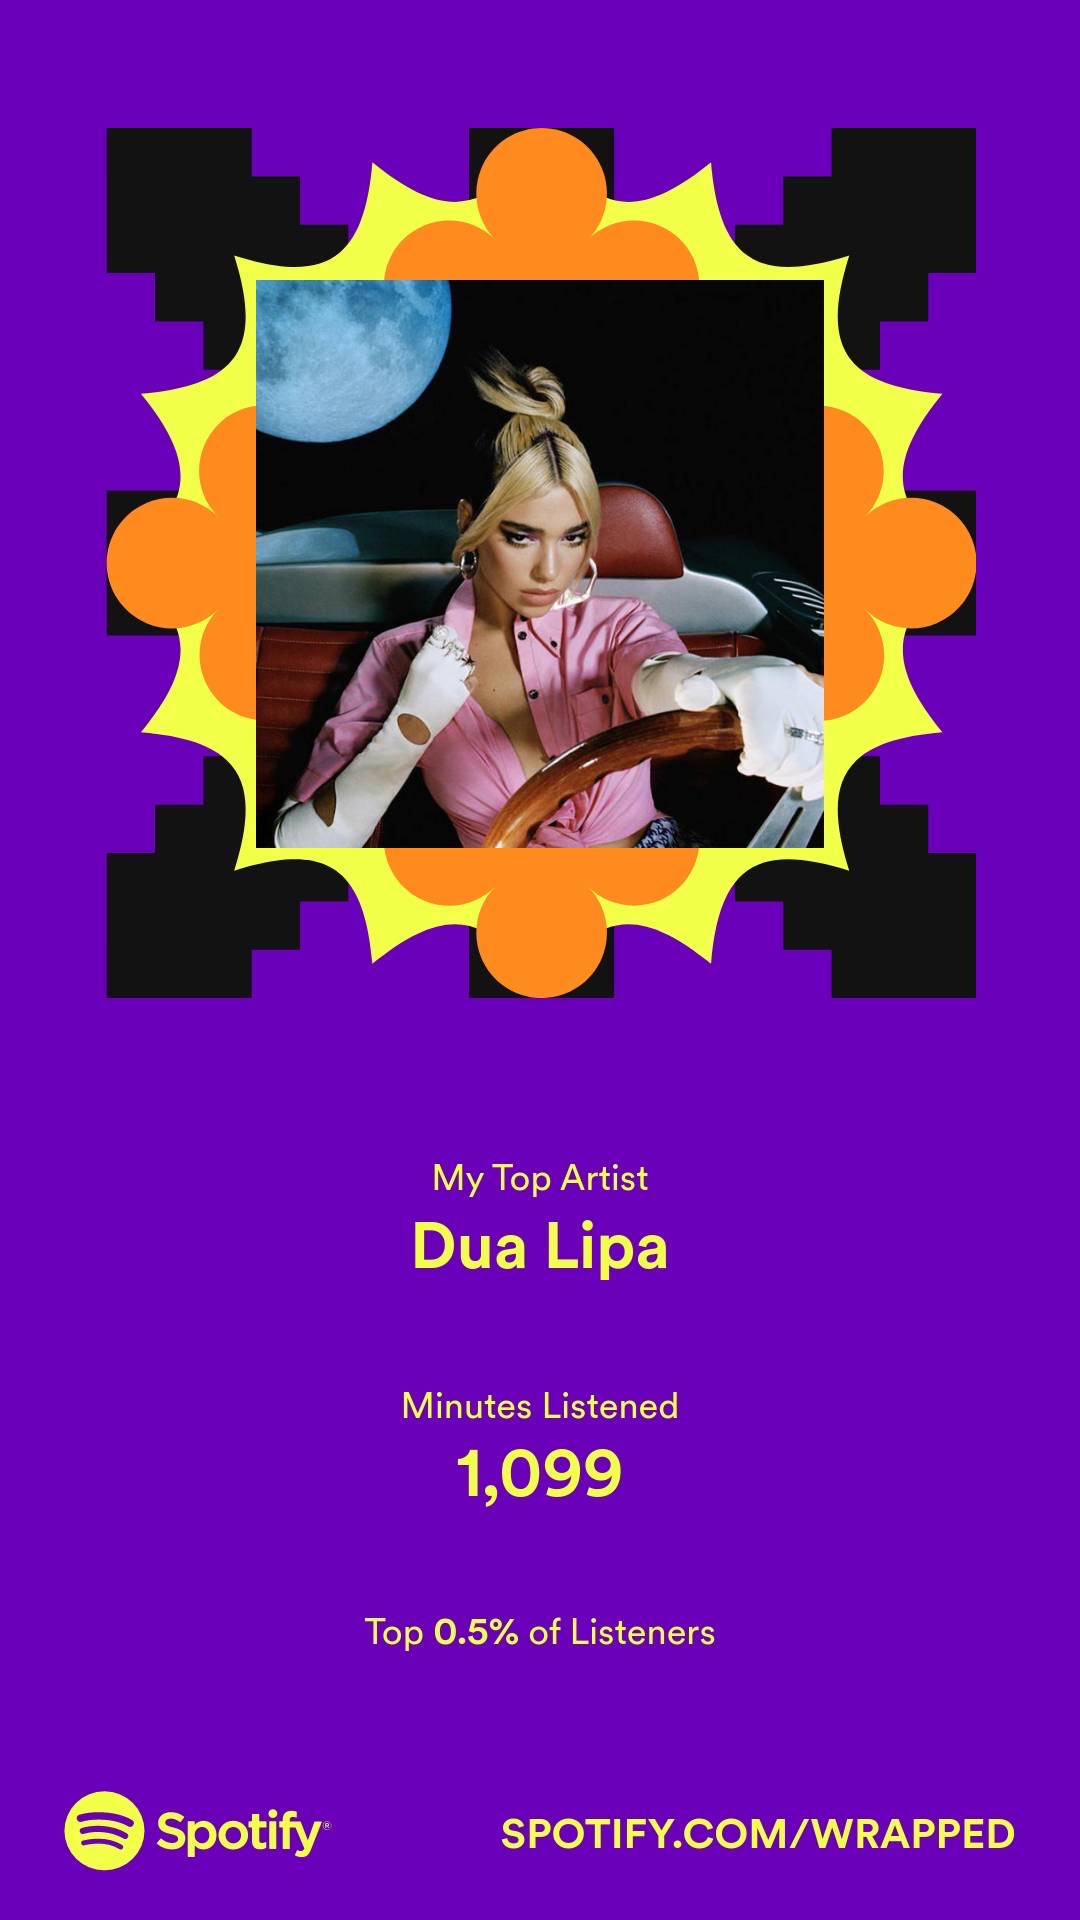
Screenshot from Spotify
What makes Spotify Wrapped special is how it provides insightful data to users; it’s one of the most anticipated releases of the year for some. Spotify won’t send out a boring, generic email like:
“Hi [insert name here]” format.
They deliver the report directly within the app to users as they eagerly anticipate a push notification that says something along the lines of, “Your Spotify Wrapped is here!” Why are users waiting with anticipation to view data? Well, because Spotify Wrapped is fun and interactive.
As B2B marketers, we should pay close attention to what Spotify is doing; for the first time in history, they’ve just made reporting data a cultural event.
So how does this impact your B2B reporting? You may be saying, “We don’t have music to share with customers.” That may be, but you certainly have an interesting story to tell!
Here’s how to do it with your data:

Know Your Audience and Don’t Over-Report
Spotify is worth about $67 billion. Each week, it delivers personalized playlists to its 195 million subscribers. Suffice it to say, Spotify sits on galaxies of data. The tiniest details of each user’s listening habits are algorithmically analyzed by artificial intelligence (AI) to deliver the songs they’re most likely to enjoy.
And yet, what do we see in Spotify Wrapped? Maybe four or five high-level metrics? That in itself is a lesson learned: metrics reporting shouldn’t include every data point. Over-reporting gets annoying — and overwhelming quickly for most. Sadly, digital marketers are notorious for making this mistake. What “over-reporting” looks like varies, so on every project it’s important to understand your audience and their goals.
For example: If subject line 1A improved June’s email blast open rates but isn’t relevant to the person to whom you’re reporting, there isn’t much use in including that positive metric. While those kinds of wins and metrics are important, consider how those findings might be serving your needs better than your audience or customers.
Add Some Poetry to the Numbers
Most data reports usually include basic visualizations like charts, tables, word clouds, etc., which are best used when they’re easy to understand at a glance. But sadly, that’s not always the case.
Spotify Wrapped uses their visualizations as storytelling tools. While their animated transitions between graphics and gorgeous color arrangements, etc., deserve a nod, the true masterpiece is how they present their data.
For instance, my 2021 listening habits had an aura, according to Spotify …
And this year users discovered their listening personalities.
.png)
While digital marketers work with numbers and percentages on a totally different scale — everything from tiny percentages in click-through data to multimillion impressions/views — there’s still an opportunity to tell a story.
Consider reminding your audience about what those scales and numbers really mean to them.
Did you surpass 10,000 leads this year? That could also be a sold-out stadium of people who opted in to receive your content. Did you cut your cost per conversion in half? Show your audience the kind of luxury car they can buy now with those leftover funds. Use your imagination: it can go a long way, even with basic numbers and figures.
Make That Story Worth Sharing
And let’s not forget how Spotify Wrapped makes it easy to share and compare data with your individual network. Shareable content is not only beneficial for users but Spotify too. Users can flaunt their fandom for their favorite artists. For example, our senior social media specialist, Josh, likes to brag about how he is one of Dua Lipa’s biggest fans. Well luckily for him, he has the Spotify data to back it up.
Artists also have similar user experiences for their annual Spotify Wrapped and even can share their data with fans. Popular artists can further listener awareness with official #SpotifyWrapped hashtags to engage and interact with their fans. #SpotifyWrapped has historically trended for several days and even weeks in as more people share their stories.
Duolingo, the world’s number one language learning app, also distributes a year-end review similar to Spotify Wrapped, which includes the #Duolingo365 hashtag to engage with online. The language platform provides users information specific to how much time they’ve spent learning a new language, the total words they’ve learned during that year and lesson streak data.
And for anyone who is a Duolingo “stan”, they understand the obsession with the daily streak. Check out this user’s determination with her 2,200+ day streak.
I've spent a long time learning French jn Duolingo. Consistently doing my lessons since 2015. I've finished the tree a few times,and then more lessons/levels are added. I'm not keen on losing my 2200+ days streak! #Duolingo365 pic.twitter.com/6rbcYRVUEe
— Loreto Aliaga Salas (@loreto_as) December 6, 2021
Why Is Spotify Wrapped Important to Your B2B Content Strategy?
It’s true: Spotify’s unique user experience and content strategy can help you engage with customers and share data in a different way. A few things to consider:
1. Determine which pieces of content this year were the most popular with your audience.
Did you or your customers have a blog, white paper or podcast that was timely and resonated with your audiences? Aggregate data for those top 3 to 5 pieces of content and highlight them in a unique way. It’s a great method to repurpose content at the end of the year.
2. Make it visual and personal.
It’s easy to share static posts with a traditional CTA. But consider how you can engage with your audience and create visual content that’s really shareworthy. Don’t believe us? Take note of how your personal connections engage and share their personal Spotify Wrapped content this year.
3. Present your data in a different way.
Digital marketing and data analytics often receive a bad rap. But as we’ve learned from Spotify, they can create a unique picture of our buying habits and illustrate how users engage with content. Consider what’s important for your customers’ unique goals and create dashboards, reports or even something new that caters to actionable information. Take a bit of the scariness out of the numbers and get them excited about what the data can teach them.
Our Wrap-Up
As marketers, we often take complicated concepts and simplify them for our customers. Spotify is doing just that and reminds us our reporting should be no different.
The more we can simplify our relationship with data, the more we can evolve beyond a cultural norm of basic data literacy and into one of data empowerment — one in which number crunching isn’t inaccessible to anyone who isn’t a seasoned mathematician.
For a little additional inspiration, check out how Spotify Wrapped is made.
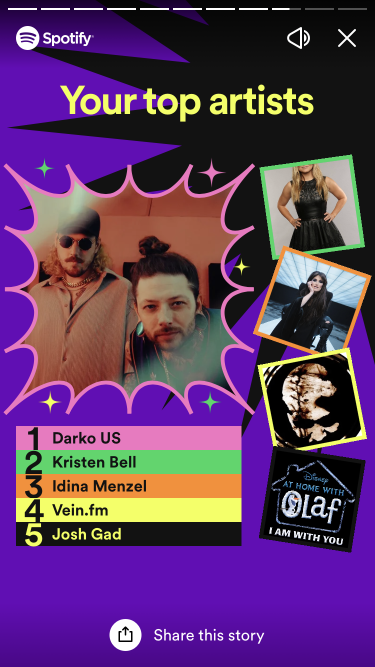
Screenshot from Spotify.